
A scenario analysis of four Oracle credits across holding periods from one to twenty years. I wanted to analyze how the returns would fluctuate with various market yields, and I learned a lesson in reinvestment risk for long bonds.
This year I have learned a lot about credit investing and have grown a significant interest in the asset class. This month I have been working through four Oracle Corporation senior unsecured notes. Every one of them traded below par, some of them far below. The 4% of 2046 was quoted at 60 cents on the dollar. Yields range from 7.65% for the 2036 maturity, to 8.53% for the 2066 maturity, against a 10-year Treasury near 5.28% and a BBB corporate index yielding roughly 6.08%.
Those are wide spreads for a nominally investment grade issuer, and the prices had gotten there quickly. Long treasury yields had backed up to multi-decade highs, and Oracle’s own credit had re-rated toward crossover pricing on questions about its capital spending program.
My first instinct was the ordinary one. Rates are still rising, the Fed has started hiking again, so buying long duration here means catching a falling knife. Every additional 100 basis points costs roughly eleven points of principal on these bonds. Then I ran total return across a range of holding periods rather than looking only at price sensitivity, and the conclusion surprised me (because I was focusing on the wrong ‘risk’).
For a holder willing to own these bonds long enough, a further rise in yields produces a higher total return than yields staying flat. Falling rates produces the worst outcome of the three scenarios I tested, which I didn’t consider given the expectation falling rates increase a bond’s price. The mechanism is reinvestment risk, which I understood was the risk that yields would not be as favorable when your current bond matures but didn’t consider the benefits of it.
What follows works through that analysis on the actual Oracle paper. The specific numbers belong to these four bonds and their particular durations, so they will not transfer to your holdings. The overall framework will.
The Four Bonds
All four are Oracle senior unsecured notes, quoted at the September 30th, 2026. Using one issuer across four maturities holds credit quality constant, which isolates the variable I actually wanted to study.
| Bond | Price | Yield to maturity | Modified duration |
|---|---|---|---|
| 5.70% Feb 2036 | 88.01 | 7.65% | 6.88 |
| 4.00% Jul 2046 | 59.98 | 8.21% | 11.19 |
| 6.70% Feb 2056 | 82.48 | 8.41% | 11.08 |
| 6.85% Feb 2066 | 82.08 | 8.53% | 11.39 |
For context on where these sit in the market: the 10-year Treasury traded around 5.28% and the 30-year around 5.50%, both at levels last seen in the mid-2000s. The ICE BofA BBB US Corporate index yielded roughly 6.08% at a comparable duration.
That places Oracle at spreads of roughly 230 basis points at the ten-year point, widening to about 290 at the long end. Generic BBB paper trades considerably tighter, so the market is pricing this particular borrower as a crossover credit rather than a clean investment grade one. Oracle has issued heavily to fund AI infrastructure capacity, and the credit market has been pricing the capital intensity of that program.
I am using these bonds as a case study in bond arithmetic. Whether Oracle is good credit at these spreads is a separate question that this piece does not try to answer, and running the two questions together is its own category of error. Nothing here is a recommendation on any security.
One technical note. The yields I solved run about 13 basis points above screen yields because I used clean prices without accrued interest and rounded maturity dates to the nearest half year. The bias is identical across all four bonds, so every comparison below holds even though the absolute levels are slightly off.
Reinvestment Risk for Long Bonds at 8.41%
When the screen says Oracle’s 2056 bond yields 8.41%, that number carries a condition most retail buyers never examine. Anyone who has actually bought single issuer bonds probably understands this already.
Yield to maturity is the discount rate that sets the present value of a bond’s cash flows equal to its price. It is an internal rate of return, and every IRR assumes intermediate cash flows are reinvested at the IRR itself. So 8.41% is a promise of 8.41% on the condition that every coupon you collect goes back to work at 8.41% until 2056.
Reinvest above that rate and your realized return exceeds the quoted yield. Reinvest below it and you fall short. The stated yield describes one point in a distribution of outcomes.
The assumption carries real weight on a bond like this one. A 6.70% coupon returns 3.35 points of face to you twice a year for thirty years. Over a long hold you are making sixty separate allocation decisions, each at whatever rate prevails when that coupon lands. The bond you bought is one decision; the sixty that follow are yours to make.
Reinvestment risk is the formal name for the exposure that those rates come in lower than the yield you bought at. It runs opposite to price risk in every scenario:
- Yields fall: the bond appreciates, and coupons redeploy at worse rates.
- Yields rise: the bond depreciates, and coupons redeploy at better rates.
The two effects always point in opposite directions. Which one dominates your outcome depends on how long you hold, and the rest of this analysis is an attempt to pin that down for Oracle’s specific bonds.
Zero coupon bonds sit at one extreme with no reinvestment risk at all, since there is nothing to reinvest. That property makes them the cleanest instrument for funding a known future liability, and it comes at the cost of the highest price volatility per unit of maturity.
Duration, Not Maturity, Decides Reinvestment Risk
Before the scenario math, one measurement problem has to be cleared up, because it changes which Oracle bond you would want.
Look again at the durations. The 2046, 2056, and 2066 maturities span twenty years of calendar time. Their modified durations are 11.19, 11.08 and 11.39. For practical purposes they are the same bond.
I got this wrong on a first pass by estimating duration from maturity, and that estimation produced an outcome I had to retract. Two forces drive the convergence:
- Large coupons pull duration down. Duration measures the weighted average time to receive a bond’s cash flows. A 6.85% coupon returns a substantial share of your money early, which front-loads that average. The 2066 note runs forty years to maturity, but its coupon means most of the present value arrives well before then.
- Deep discounts push duration up. The 4% of 2046 trades at 60 cents. Its small coupon leaves the bulk of value in the principal repayment twenty years out, stretching the weighted average. A low coupon bought at a deep discount produces duration far longer than the coupon rate alone suggests.
So the 4% of 2046 and the 6.85% of 2066 carry effectively the same interest rate risk despite twenty years of maturity difference.
That has a direct consequence in this set. The 4% of 2046 is dominated: the 6.70% of 2056 offers the same duration, 20 basis points more yield, and a tighter quoted market. Screening on maturity hides that completely. Screening on duration surfaces it in one line.
The comparison that falls out is yield per turn of duration, or how much compensation you collect per unit of interest rate risk:
| Bond | Yield ÷ Duration |
|---|---|
| 5.70% 2036 | 1.11 |
| 6.70% 2056 | 0.76 |
| 6.85% 2066 | 0.75 |
| 4.00% 2046 | 0.73 |
The ten year bond delivers roughly 46% more yield per unit of risk than anything longer in the set. Whether that makes it the better purchase depends entirely on the holding period, which the next two sections work out.
Price Risk Dominates Reinvestment Risk for Shorter Holding Periods
Start with the familiar case. Here is annualized total return on all four Oracle bonds over one to five years, assuming yields move 100 basis points higher and stay there.
| Bond | 1y | 2y | 3y | 4y | 5y |
|---|---|---|---|---|---|
| 5.70% 2036 | +1.58 | +5.10 | +6.31 | +6.92 | +7.28 |
| 4.00% 2046 | −2.02 | +3.48 | +5.38 | +6.35 | +6.94 |
| 6.70% 2056 | −1.58 | +3.82 | +5.69 | +6.64 | +7.21 |
| 6.85% 2066 | −1.66 | +3.83 | +5.73 | +6.70 | +7.29 |
And with yields 100 basis points lower:
| Bond | 1y | 2y | 3y | 4y | 5y |
|---|---|---|---|---|---|
| 5.70% 2036 | +14.36 | +10.46 | +9.20 | +8.57 | +8.19 |
| 4.00% 2046 | +20.28 | +13.58 | +11.43 | +10.38 | +9.75 |
| 6.70% 2056 | +20.59 | +13.84 | +11.68 | +10.61 | +9.98 |
| 6.85% 2066 | +21.25 | +14.22 | +11.97 | +10.86 | +10.20 |
Three observations stand out.
The underwater window is roughly thirteen months. A full 100bp shock produces a negative year only in year one, and only for the long bonds, by 1% to 2%. Everything turns positive by year two. Coupons this size absorb a 100bp move in about a year, which is a considerably less frightening picture than a price chart suggests.
Convexity works in your favor. Measured against the flat case, a 100bp rise costs the 2056 bond about 10.1 points at one year while a 100bp fall gains 12.1. That asymmetry is worth roughly a point a year at these durations, and it is the genuine structural benefit of owning the long end of a credit curve.
The spread of outcomes narrows sharply. At one year the 2056 spans a 22 point range across the two scenarios. At five years the range is 2.8 points. A view on rates matters enormously over twelve months and much less over five years.
That third observation is the hinge. Push the horizon out further and the range does more than narrow.
Reinvestment Risk for Long Bonds and Longer Holding Periods
Now extend to twenty years and widen the shocks to a 250 basis point increase against a 150 basis point decrease. Annualized total return on the 6.70% of 2056:
| Scenario | 5y | 10y | 15y | 20y |
|---|---|---|---|---|
| Yields +250bp | 5.61 | 8.33 | 9.26 | 9.74 |
| Yields flat | 8.50 | 8.51 | 8.52 | 8.53 |
| Yields −150bp | 10.80 | 8.88 | 8.25 | 7.94 |
The same exercise on the 6.85% of 2066:
| Scenario | 5y | 10y | 15y | 20y |
|---|---|---|---|---|
| Yields +250bp | 5.68 | 8.43 | 9.37 | 9.85 |
| Yields flat | 8.62 | 8.63 | 8.64 | 8.65 |
| Yields −150bp | 11.10 | 9.08 | 8.42 | 8.10 |
Read down the columns rather than across the rows. At five years the ordering matches intuition, with falling yields best and rising yields worst. At twenty years the ordering has reversed. On these bonds, falling yields deliver the worst twenty year outcome of the three scenarios.
The cumulative figures make the size of the effect clearer. A 250bp shock compounds the 2056 bond to 542% of the original investment over twenty years. Flat yields produce 414%. A 150bp decline in yields produces 361%.
Put differently, a 150 basis point decline in yields costs a twenty year holder of this bond roughly 180 percentage points of cumulative return compared with a 250 basis point increase. The scenario that looks like good news on a monthly statement does the most damage to long run compounding.
Higher yields help a long horizon holder through a specific channel: every coupon collected over those twenty years gets reinvested at the higher prevailing rate. On a bond paying 3.35 points of face twice a year, that stream of reinvested income becomes the dominant driver of terminal wealth, and paying it at 10.9% instead of 8.4% compounds into a very large difference. The section after next quantifies exactly how large.
Where Price Risk Loses to Reinvestment Risk for Long Bonds
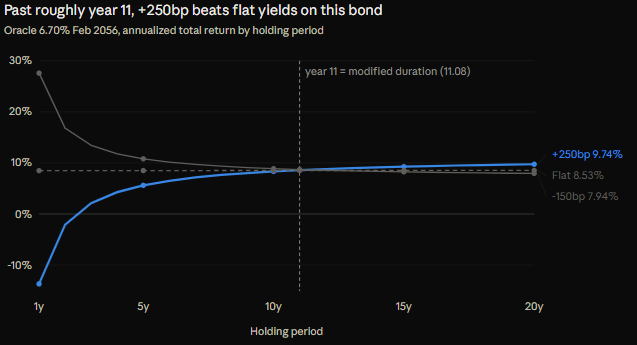
Solving for the horizon at which the +250bp path equals the flat path gives 10.7 years for the 2056 bond and 10.8 years for the 2066. Their modified durations are 11.08 and 11.39.
Those pairs land close together for a reason. This is the immunization result, one of the few clean theorems in fixed income: ‘At a holding period near a bond’s duration, the capital loss from rising yields is offset by the additional income earned reinvesting coupons at those higher yields’.
So duration does double duty. It measures price sensitivity, and it also marks the approximate break-even holding period at which price risk and reinvestment risk cancel.
Hold shorter than that and price effects dominate, which leaves you effectively short interest rates. Hold longer and reinvestment effects dominate, which leaves you effectively long interest rates. The sign of your rate exposure flips somewhere around duration while nothing about the bond itself changes. Only your horizon does.
The number that falls out of these Oracle bonds is roughly eleven years, and it belongs to these bonds alone. A five-year corporate note has a duration near four, so its crossover sits near year four. A thirty-year zero-coupon Treasury has a duration of thirty, and its crossover sits at thirty. Take the concept from this analysis and compute the number for whatever you actually hold.
This mechanism is why a pension fund with thirty-year liabilities does not panic when rates rise. Its assets mark down while its forward compounding rate improves, and when asset duration roughly matches liability duration the two largely offset. The red number on the statement reflects timing rather than economics.
Reinvestment Risk in the Numbers: Where Return for Oracle’s Credit Comes From
The reasonable objection at this point is that the bond price stays permanently worse in the rising yield case, so the total cannot come out ahead. Decomposing a twenty year hold on the 2056 note settles it.
| Per 100 face | Yields flat | Yields +250bp |
|---|---|---|
| Price the day of the shock | 82.48 | 64.11 |
| Bond price at year 20 | 90.08 | 76.70 |
| Raw coupons received | 134.00 | 134.00 |
| Interest-on-interest | 200.12 | 318.49 |
| Total value | 424.19 | 529.19 |
The objection holds on the price line. At year 20 the shocked bond sits at 76.70 against 90.08, some 13.4 points behind, and it never closes that gap. Both instruments redeem at 100 in 2056, and the high yield path approaches par from further below the entire way.
That cost is real, and it is also small relative to everything else. At year 20 the bond’s price accounts for 14% of total value. Interest-on-interest accounts for 60%.
That number deserves a second read. Over a twenty year hold on this Oracle bond, roughly half of terminal wealth comes from money earned on coupons rather than from the bond itself. The raw coupon stream contributes 134 points. Compounding those coupons contributes another 200 to 318 points depending on the rate environment. The instrument you bought is a minority of the outcome.
The mechanism behind the crossover now becomes visible. The capital loss is a one-time subtraction of about 18 points. The reinvestment advantage is a recurring multiplier, adding 250 basis points on a steadily growing pile of reinvested coupons every period. Fixed subtractions lose to compounding multipliers given enough periods, and on these bonds “enough periods” works out to roughly their duration.
The handoff is visible in the path. Cumulative value per 82.48 invested runs 18.3 points behind at year 1, still 15.7 behind at year 5, only 3.1 behind at year 10, ahead from year 11, and 105 points ahead by year 20.
Reinvestment Risk Cuts the Other Way Too
Every figure above assumes you reinvest each Oracle coupon at the shifted yield, meaning 10.9% for twenty consecutive years in the +250bp case. That assumption carries enormous weight, and the honest version of this analysis has to show what happens without it.
Here is the same exercise with coupons reinvested at a flat 4%, roughly a cash rate:
| 6.70% 2056, reinvested at 4% | 5y | 10y | 15y | 20y |
|---|---|---|---|---|
| Yields +250bp | 4.34 | 6.07 | 6.32 | 6.28 |
| Yields flat | 7.80 | 7.26 | 6.85 | 6.53 |
| Yields −150bp | 10.39 | 8.13 | 7.23 | 6.70 |
The crossover disappears entirely. At 4% reinvestment, rising yields are the worst outcome at every horizon tested, and the twenty year +250bp return falls from 9.74% to 6.28%.
That 3.5 point gap is the entire argument of this piece, and it rests on an operational question rather than a market one.
Two distinct risks sit inside the optimistic version. The first is that yields have to stay elevated for you to keep reinvesting at 10.9%. A permanent parallel shift is a modelling convention, not a forecast. Real yields mean revert, so any realistic path lands somewhere between these two tables.
The second risk is more mundane and much more within your control. You have to actually redeploy the coupons. If Oracle’s semi-annual interest payments accumulate in a sweep account earning cash rates, you get the bottom table regardless of what happens in the bond market. Over twenty years that gap exceeds a third of your return.
This reframes what buying a long Oracle bond actually commits you to. You are buying a yield and simultaneously committing to a reinvestment program, and the discipline of that program matters more to your outcome than the entry yield you negotiated.
It is also the strongest practical case for defined maturity bond ETFs, laddered structures, or any vehicle that automates redeployment. The automation addresses the single largest source of shortfall in long horizon fixed income.
How Reinvestment Risk Changed My Mental Model
I came into this work thinking about Oracle’s bonds the way most people think about bonds in a rising rate environment, which is to say defensively. Wait for yields to peak, then buy. Five things changed after running the numbers.
Duration is a holding period, not only a sensitivity. I had used duration purely as a price-move estimator. Seeing the crossover land near duration on both long Oracle bonds reframed it as the horizon at which my rate exposure changes sign. That single reframing does more work than any rate forecast I could produce.
The dangerous variable is horizon uncertainty rather than rate uncertainty. A long Oracle position held with certainty to year fifteen is helped by a rate backup. The same position held with a possibility of forced sale in year three is badly hurt by one. Underwriting my own liquidity needs matters more than underwriting the Fed.
Maturity is a poor proxy for risk. The four Oracle bonds span thirty years of maturity and cluster into two duration buckets. Screening on maturity led me to recommend the wrong bond, and I had to retract it once I computed duration properly. The 4% of 2046 is dominated by the 6.70% of 2056 on identical duration with more yield, which maturity screening conceals entirely.
Yield per turn of duration is the comparison worth making. Oracle’s ten year note pays 7.65% at 6.88 duration. The forty year pays 8.53% at 11.39. The long bond offers 88 basis points more for 66% more interest rate risk, and whether that trade works depends on holding period.
The reinvestment program is part of the investment. Buying a 6.70% coupon means committing to sixty future allocation decisions. Treating those as an afterthought means realizing the 4% reinvestment table while quoting the headline yield to myself.
The broader shift is that fixed income risk depends on the holder as much as the instrument. The same Oracle bond functions as a rate hedge for one investor and a rate bet for another, determined by how long each intends to hold it. That is a different way of reading a bond screen than I had before.
What My Analysis Leaves Out
Five things, any of which could matter more than everything above.
Default. Every figure assumes Oracle pays in full. Duration arithmetic is indifferent to credit quality while realized returns are not. A twenty year hold on a single crossover rated credit carries a cumulative default probability in the high single digits, and no amount of reinvestment math compensates for permanent capital loss. Extending from a ten year assumption to a twenty year one strains hardest here, because it means underwriting Oracle’s competitive position two decades out.
Non-parallel shifts. I shocked each bond’s own yield in parallel, which reasonably approximates a Treasury move. It badly understates a credit event. A downgrade would produce a larger move at the long end, widen bid-ask from one point to several, and trigger forced selling from investment grade mandated holders that overshoots fundamentals. The +250bp column describes a rates scenario rather than a credit scenario.
Taxes. All figures are pre-tax, and the after-tax picture is materially worse for individuals holding in taxable accounts. Coupon income is ordinary. Bonds purchased below par also carry market discount under IRC §1276, which returns the pull-to-par appreciation as ordinary income rather than capital gain. That rule inverts the apparent attractiveness of the deeply discounted bonds in this set, since the 4% of 2046 at 60 cents carries forty points of it. At a combined marginal rate near 50%, halve every figure above. The practical implication is that long corporate bonds belong in tax sheltered accounts.
Execution and liquidity. Retail sized corporate bond trades are odd lots and price worse than the institutional quotes on a screen. Across these four Oracle bonds, quoted round-trip spreads ranged from 0.22% to 1.19%, a fivefold difference between the most and least liquid issue from the same borrower. On a short hold, execution can consume a year of yield advantage. On a twenty year hold it barely registers, which is one more way horizon governs the outcome.
Roll-down, which is excluded in the opposite direction. Oracle’s credit curve slopes upward, so aging bonds roll toward lower yields and pick up return the flat scenario does not credit. The flat case figures are therefore conservative, most so for the ten year bond.
Method, Sources, and Further Reading
Method. Prices and yields are end-September 2026 market quotes on four Oracle Corporation senior unsecured notes. Yields to maturity were solved numerically from clean prices assuming semi-annual coupons, with maturity rounded to the nearest half year and accrued interest excluded. That biases solved yields roughly 13 basis points above screen yields, identically across all four bonds. Modified duration is computed by symmetric finite difference at plus and minus one basis point.
Total return scenarios assume the yield shift occurs immediately and persists, coupons are reinvested semi-annually at the shifted yield except where the 4% sensitivity is stated, the bond is marked at the shifted yield at the horizon, and no default occurs. Annualized figures are effective annual rates, which is why flat scenario returns sit slightly above the stated semi-annual bond equivalent yields. An 8.41% bond equivalent yield converts to 8.59% effective annual, and the small remaining difference comes from the rounding described above.
On what this is. I have been reading credit investing broadly over the past several months and wanted to pressure test the standard duration intuitions against live paper rather than textbook examples. These four Oracle credits served as that test case. Nothing here is a recommendation to buy or sell any security, and whether Oracle represents good credit at these spreads is a question I have deliberately left alone.
Further reading. A great deal of what pushed me toward thinking rigorously about credit came from JunkBondInvestor on Substack (JBI). I have no affiliation and no relationship with JBI, I have simply learned a lot from their writing, particularly on reading credit as a discipline in its own right rather than as equity analysis with a different payoff structure. JBI has been writing many pieces on all the Hyperscaler new issuances this year and the overall credit market, definitely check out their work.
I will work on posting more and do some deep analysis like this again shortly.